The supply of international units is forecast to far exceed demand over the period to 2020. As a result, credible emissions reductions are currently trading at historically low prices and are expected to remain available at low prices over the period to 2020.
A decision to use international units to help meet Australia’s emissions reductions targets will be informed by the availability and cost of those units. This chapter assesses the supply, demand and price of units considered suitable for Australian use.
The market for international units will evolve over the period to 2020. It will be influenced by progress in international climate negotiations, other countries’ decisions on targets and policies, and a range of economic factors including economic growth, fuel prices and technology costs. The Authority has drawn on available analysis from a range of market analysts to form a view on the likely availability and cost of international units suitable for Australia. All of this analysis suggests there will be ample supply of suitable units available at low cost to meet Australia’s requirements.
4.1 Supply of international units to 2020
The CDM and other Kyoto Protocol market mechanisms discussed in Chapter 3 have been operating for a number of years, resulting in a substantial pipeline of units to the market in the future. This section examines that pipeline, focusing on CERs which are likely to dominate supply out to 2020. This chapter excludes other types of units: units from JI and new market mechanisms (because arrangements are still being finalised); AAUs (because their eligibility would require an assessment of the stringency of individual countries’ targets); and RMUs (because they are not expected to be available in significant quantities). It follows that the supply of suitable units is likely to be greater than estimated in this analysis.
Estimates of the potential supply of CERs from existing projects in the period to 2020 range between 2 and 4 billion units (BNEF 2014; Vivid 2013; Point Carbon 2014). These estimates include CERs from the first and second commitment periods that have already been issued, and potential future issuance.
Actual supply over the period will depend on prices, issuance rates and project success/failure rates. If prices remain low, many projects will be unable to recover monitoring, auditing and other costs of issuing units. Some projects will also issue fewer credits than they anticipate, and other projects may not continue. The cost of generating units is typically higher for new projects than existing projects. New projects need to recover all project costs including capital, scheme participation, ongoing operating costs, and monitoring and auditing costs. Existing projects need only to recover ongoing operating costs, and monitoring and auditing costs, because other up-front costs have already been incurred.
Figure 4.1 shows one possible supply curve for CERs to 2020, produced by Bloomberg New Energy Finance. Table 4.1 shows the cost of different types of new projects, as estimated by Ecofys and Climatekos.
Figure 4.1: Possible supply response to rising prices, 2014–20
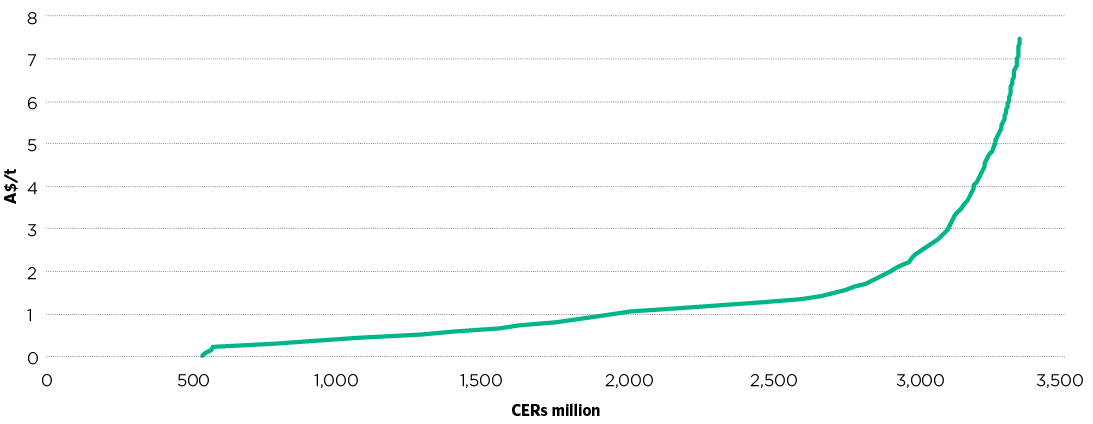
Note: The Climate Change Authority used the RBA three-month average exchange rate to end May 2014 to convert the BNEF forecast from Euro to Australian dollars.
Source: BNEF 2014
Table 4.1: Estimated costs of new CDM projects
|
Project type |
Abatement cost (A$/t) |
Transaction cost (A$/t) |
Total cost per unit (abatement + transaction costs) |
|
N2O nitric acid |
Around 0 |
0.33–0.41 |
Around 0.37 |
|
Coal mine/bed methane |
Around 0 |
0.33–0.41 |
0.24–0.37 |
|
Energy Efficiency – own generation |
Around 0 |
0.32–0.46 |
0.37–0.49 |
|
Landfill gas |
0–4.76 |
0.40–0.55 |
0.37–5.25 |
|
Hydro large-scale |
0–4.76 |
0.32–0.44 |
0.37–5.25 |
|
Hydro small-scale |
0–4.76 |
0.62–1.10 |
0.61–5.86 |
|
Biomass energy |
0–4.76 |
0.60–0.99 |
0.61–5.73 |
|
Methane avoidance |
0–4.76 |
0.66–1.22 |
0.61–5.98 |
|
Energy Efficiency households |
0–4.76 |
0.71–1.62 |
0.73–6.34 |
|
Wind large-scale |
4.76–9.52 |
1.12–1.93 |
5.12–10.13 |
|
Wind small-scale |
4.76–9.52 |
0.50–1.11 |
5.86–11.47 |
|
Solar |
>9.52 |
0.40–0.60 |
Above 9.88 |
|
Fossil fuel-switching |
Estimates vary |
0.26–0.29 |
Estimates vary |
Note: Abatement costs include construction, operation and maintenance costs and revenues from the operation of the CDM project. Transaction costs include upfront fixed costs to develop the CDM project design documents, validation, registration, monitoring system establishment costs, and the ongoing costs for monitoring, reporting and verification. The Climate Change Authority used the relevant RBA exchange rates on 3 April 2013 (consistent with the exchange rate calculations in the source) to convert unit costs to Australian dollars.
Source: Ecofys and Climatekos 2013; RBA 2014
In summary, the particular forecasts suggest that the bulk of the potential supply from existing projects would be available at prices of less than $2, and that many new projects would be able to supply units at prices under $7. These are, of course, estimates, and would change as underlying assumptions change.
China is expected to be the largest source of the supply from existing projects over the period to 2020, with a growing share from the Americas, India and other countries in Asia (Figure 4.2). CERs from renewables projects are projected to make up the greatest bulk of this supply.
As discussed in Chapter 3, the Authority considers that Australia should exclude some units from the total potential supply. Specifically, the Authority suggests Australia exclude CERs from certain projects, including industrial gas destruction (HFC-23 and N2O from adipic acid production), some large hydroelectricity projects, and afforestation and reforestation projects (see Section 3.2.3). This is estimated to reduce supply of units from existing projects by around 300 million units over the period to 2020 (BNEF 2014, Vivid 2013), to around 1.5-3.5 billion units.
Chapter 3 also highlighted the importance of ensuring the emissions reductions Australia buys are not also counted by the selling country (see Section 3.2.2). Most countries, including China, have not yet indicated whether they intend to count the emissions reductions underpinning CERs towards meeting their own goals. This concern only relates to second commitment period CERs; first commitment period CERs are suitable for Australia’s use. Once positions are clarified, volumes available to Australia would become clearer. If, to avoid the risk of double counting, Australia excluded second commitment period CERs from some of the large supply centres, such as China and the Americas, then this could significantly reduce potential supply from existing projects. Australia may need to source CERs from new projects in other countries where the emissions reductions are not double counted at a higher price.
Assuming that the risks of double counting can be resolved, the potential supply of preferred units from existing projects is estimated to be in the order of 1.5-3.5 billion units. Additional supply of preferred units could be sourced from new projects. This suggests that even when the preferences discussed in Chapter 3 are taken into account, supply is expected to be sufficient over the period to 2020 to meet Australia’s needs.
Figure 4.2: CER supply composition to 2020—by host country region and technology
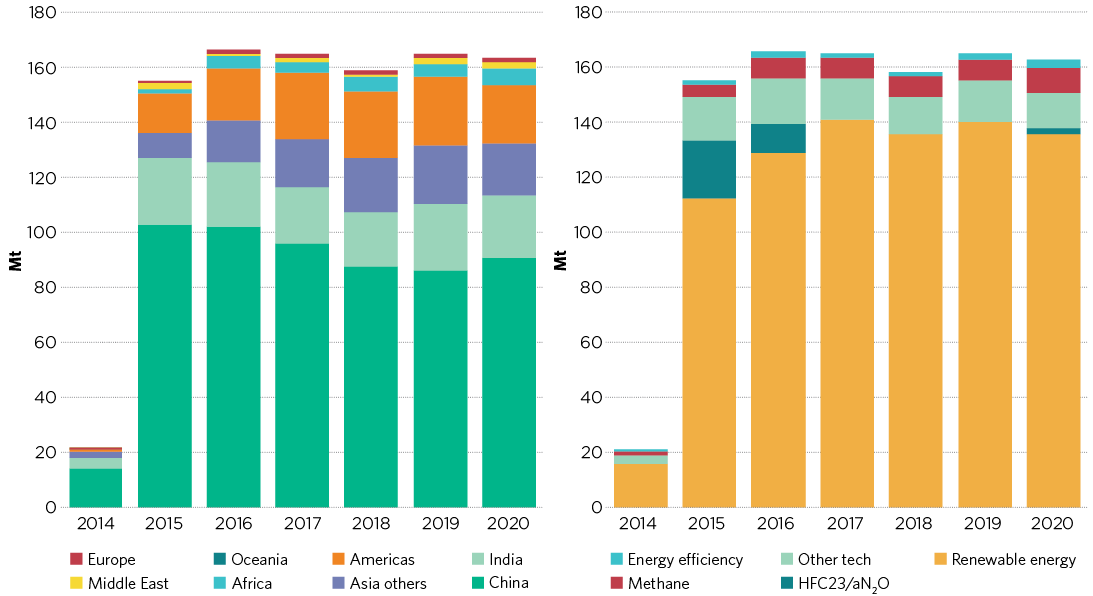
Source: BNEF 2014
4.2 Competing demand and implications for prices
Global demand for international units (excluding any demand from Australia) to 2020 is estimated by some analysts to total between 1.7 and 2.2 billion units (BNEF 2014; Point Carbon 2014), compared with total potential supply from existing projects of between 2 and 4 billion units. These projections include demand from countries with Kyoto Protocol targets and countries using CDM projects to help achieve national commitments outside of the Protocol. The projections also cover demand from both direct government purchase and private sector purchase for compliance with domestic emissions trading schemes (such as the EU ETS and the Chinese pilot schemes). Further sources of demand may emerge as post-2020 international arrangements are finalised.
The price of international units will reflect the balance of supply and demand at particular points in time. Figure 4.3 compares the expected global demand (excluding any Australian demand) with the supply curve discussed in Section 4.1. It suggests that the potential supply of units from existing projects far exceeds projected demand. It also suggests that global demand could need to increase significantly before any appreciable rise in prices.
Each buyer of units will have its own rules for identifying eligible units. European demand will reflect the rules of the EU ETS, as well as Europe-wide rules and individual country preferences. China, the Republic of Korea and South Africa could generate significant demand for use in their domestic emissions trading schemes (demand from these countries would be limited to domestic emissions reduction projects). The resultant different sets of rules could lead to some market segmentation, with different units trading at different prices. CERs from South Africa and the Republic of Korea are, for example, likely to sell at a premium because current supply is insufficient to meet their anticipated domestic demand. Analysts expect that the price of most other CERs will remain low in the period to 2020.
Figure 4.3: Demand and supply balance, 2014–20

Note: The Climate Change Authority used the RBA three-month average exchange rate to end May 2014 to convert BNEF forecast to Australian dollars.
Source: BNEF 2014; RBA 2014
4.3 Implications for Australia
Supply of international units greatly exceeds current demand. Even if Australia added to this demand by purchasing international units, on the basis of current market forecasts it appears prices would not be significantly affected.
The level of any Australian demand in the period to 2020 would depend on the target the government settles on for 2020 and the level of domestic emissions reductions achievable over that period. Australian demand would be modest, for example, if the minimum 5 per cent target is retained and international units are purchased only to cover any shortfall from domestic efforts. If international units are used to move beyond the 5 per cent target, Australian demand could be more significant but still readily accommodated within projected potential supply.
Some market forecasts suggest that sufficient units to move from a 5 to 19 per cent target (427 million units) could be procured at prices of less than $1.15 per unit, with a total cost of under $500 million (Figure 4.4).
An important caveat to this conclusion is whether countries adequately deal with the risk of double-counting, particularly for large supply sources like China and the Americas. At worst Australia will be limited to first commitment period units, plus units from projects in countries where there is no risk of double counting. This could mean having to source units from new projects in those countries, and having to pay a higher price. The total cost of moving to the 19 per cent target in this worstcase scenario would approach $3 billion (assuming a price of about $7 per unit, see Table 4.1).
Predicting future market conditions always involves dealing with uncertainties and risks. Developments that could push up prices include significant unforeseen demand from other countries, and the emergence of periods of illiquidity. Some existing market capacity (including project developers, auditors, traders and lawyers) could also be lost if prices remain very low, reducing the market’s responsiveness to new demand. On the other hand new supply could come to market—for example, once arrangements for the JI and new market mechanisms have been finalised.
Early establishment of a government purchasing capability and program early would allow Australia to benefit from current market conditions while having the flexibility to purchase units over time.
Timing considerations are also relevant here if Australia wished to buy first commitment period units. An estimated 383 million of first commitment period CERs and ERUs are currently available (BNEF 2014). As discussed in Chapter 3, these units will be cancelled unless they are used to help meet first commitment period targets, or are carried over into the second commitment period. The compliance process for the first commitment period (called the ‘true-up period’) is likely to occur in late 2015. Participants in the EU ETS have incentives to purchase most, if not all, of these units by March 2015, the cut-off for converting these units to doestic units in the EU ETS. If Australia wished to buy these units it would seem prudent to do so before March 2015, and essential to do so before true-up. After the true-up period, only second commitment period units will be available.
Figure 4.4: Projected CER supply, demand and prices, 2014–20
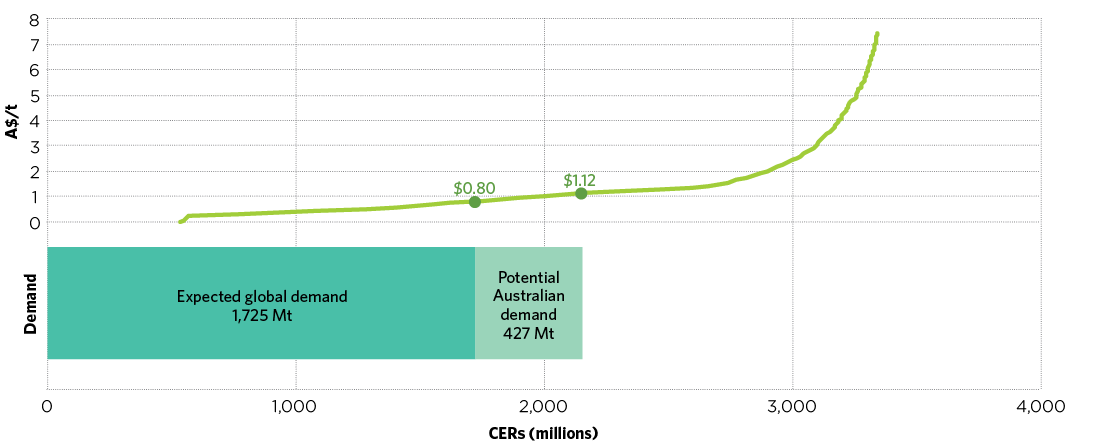
Note: The Climate Change Authority used the RBA three-month average exchange rate to end May 2014 to convert BNEF forecast to Australian dollars.
Source: BNEF 2014; RBA 2014